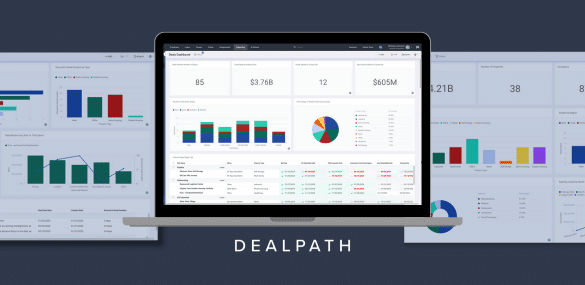
The more data at your real estate investment management firm’s disposal, the better-positioned you are to maximize returns. But without a centralized database to standardize and analyze this data, your competitive advantage could be locked away in spreadsheets. Leading teams are relying on real estate dashboards in Dealpath to power their investment strategies, from pipeline through portfolio management and disposition.
Analysis that once required hours of hunting down updates and compiling reports is now possible in minutes. You could build a real estate dashboard template in Excel, but why spend time standardizing data when you can tap into live insights? Real-time, up-to-the-minute reporting dashboards in Dealpath help you leverage institutional knowledge to make the best investment decisions, gain stronger conviction, and fuel better decisions over time.
In this blog post, we’ll review the eight most popular real estate dashboards that customers rely on in Dealpath to operate with real-time, market-leading insight.
What Is a Real Estate Dashboard in Dealpath?
Real estate dashboards are reporting visualizations that elevate insights beyond simple reports by incorporating other relevant analytics displayed in charts, graphs and tables.
By streamlining how you analyze and consume this data, real estate dashboard software should elevate your decision making.
In the past, these insights were typically only available through real estate dashboards created via Power BI or Tableau. Now, in Dealpath, teams can access this information without the need to funnel it into a downstream system.
Create Customizable Dashboards
With Dashboard Reporting, you can set up customizable dashboards that surface only the information you care about. Want a bird’s-eye view into overall business metrics? Want to drill down into your pipeline for a particular sector or region? You can accomplish both with ease. Dashboards are fully flexible, so you can surface only the data you care about.
Be Proactive With Data
Gone are the days of having to wait for data to be corralled and reports assembled. With Dashboard Reporting, the latest data is always accessible. And when a change is made to data in Dealpath, it’s reflected in your dashboards instantaneously. Now you can quickly answer questions, investigate trends, and spot red flags without having to ask your team to put together a report.
Bring Data to Life With Visualizations
It can be difficult to spot trends just from looking at raw data. Now you can customize your reports with a range of data visualizations, from bar charts to pie graphs to tables and more. This ensures you can maximize insight by consuming data in your preferred format. You can also apply filters to both entire dashboards and individual visualizations, so you can be sure you’re looking at the most relevant data.
Save Time on Reporting
Your team can cross reporting off their weekly to-do lists. Set up dashboards once, and up-to-date information will always be there. Dashboards can be shared with the whole team and even with people outside the company, so you can seamlessly keep everyone in the loop.
1. Acquisitions Pipeline Dashboard
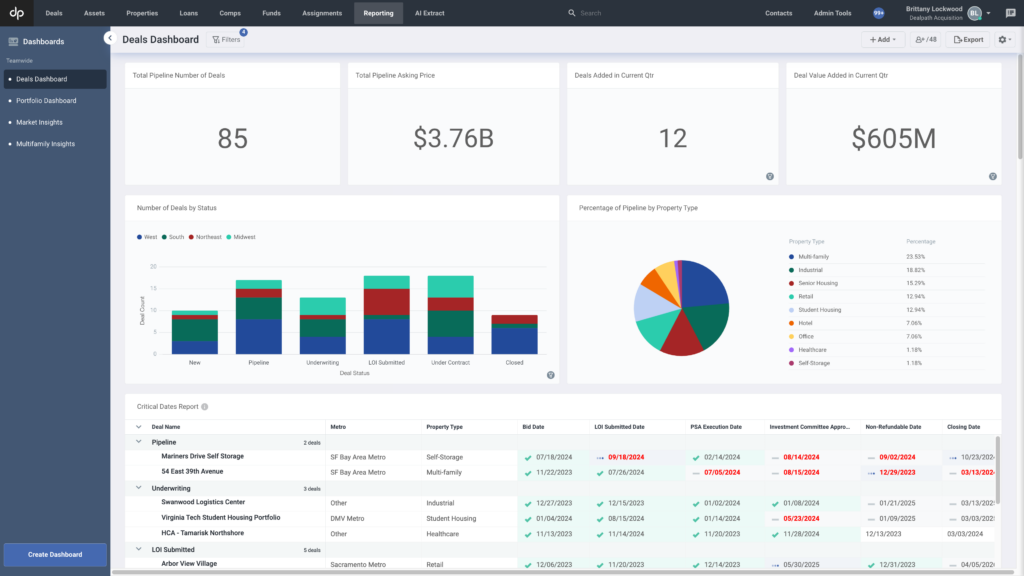
What you’ll see: Real-time acquisitions activity, pipeline volume and value, and critical dates for in-flight deals
Used by: A boutique real estate investment manager founded by a Blackstone veteran and a New York-based private investment firm that focuses on real estate and related assets
How it helps: Prioritize lucrative deals, report on progress and inform deal strategy
The faster you can understand the big picture of your acquisitions pipeline health, the sooner you can act with insight. Whether you’re prioritizing lucrative deals, reporting to senior leadership, projecting results, or validating your strategy, this real-time insight can inform decisions for investment professionals at all levels.
Acquisitions pipeline real estate dashboards are among the most common, and for good reason. Many teams rely on this real-time information to run–or even eliminate–weekly pipeline meetings. This automation and visualization ensures teams have all relevant data readily available, creating space for a productive, actionable conversation.
Monitoring pipeline volume and value in this commercial real estate metrics dashboard can help you benchmark performance each week, including progress against goals. Comparing metrics against prior months can also illustrate growth trends.
Similarly, viewing your deal pipeline by status can help track progress and the health of your funnel. Reviewing critical dates can help your team plan how to spend the coming days and weeks to prioritize accordingly.
2. Real Estate Debt Dashboard
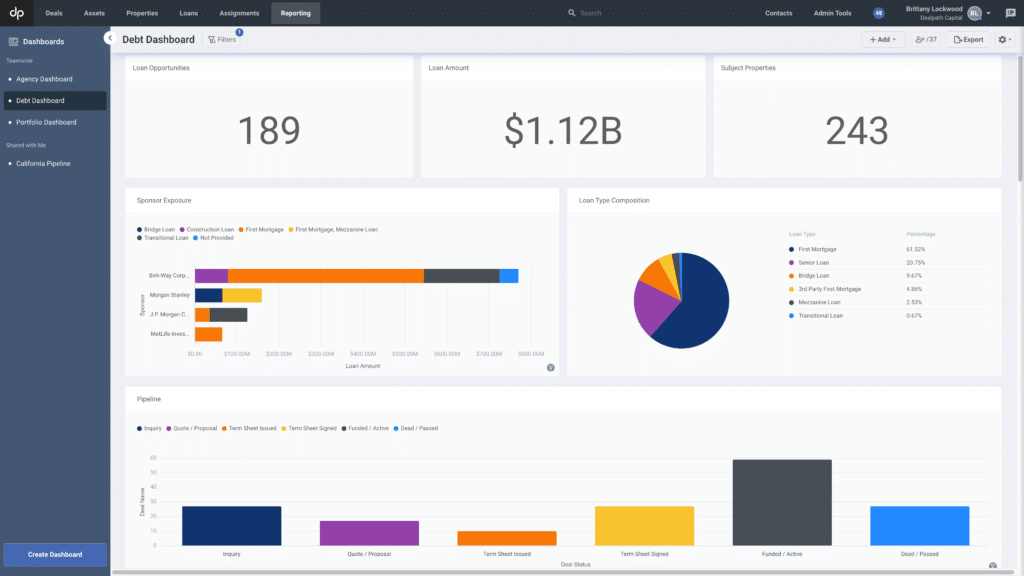
What you’ll see: Lending activity like deal count, total loan volume, sponsor exposure, and other top-line debt metrics or insights
Used by: A New York-based private investment firm specializing in real estate credit and equity investments
How it helps: Gain oversight into loan activity to deliver faster offers, proactively monitor risk, view covenants in aggregate, and make informed decisions
Particularly as debt markets heat up, clear oversight into different loans in your pipeline is vital to deliver offers before competitors. Debt dashboards offer your team a comprehensive overview of your loan pipeline, helping you track deal flow and capital deployment. Comparing covenants like DSCR, debt yield, and more is a simple yet precise way to quickly surface the most profitable loans. This holistic view also helps you understand the dollar value in each stage of your loan pipeline.
Risk metrics related to sponsors and geographies help ensure your firm is equipped to mitigate over-exposure. With these capital allocation metrics clearly displayed, you can better manage risk and inform your strategy accordingly. Similarly, viewing loans broken down by type and asset class help your firm analyze trends to prioritize high-performing products, sectors or markets.
A real estate debt dashboard can also create value for downstream teams, helping them keep a pulse on loan performance to inform portfolio and asset management decisions.
3. Dead Deal Analysis Dashboard
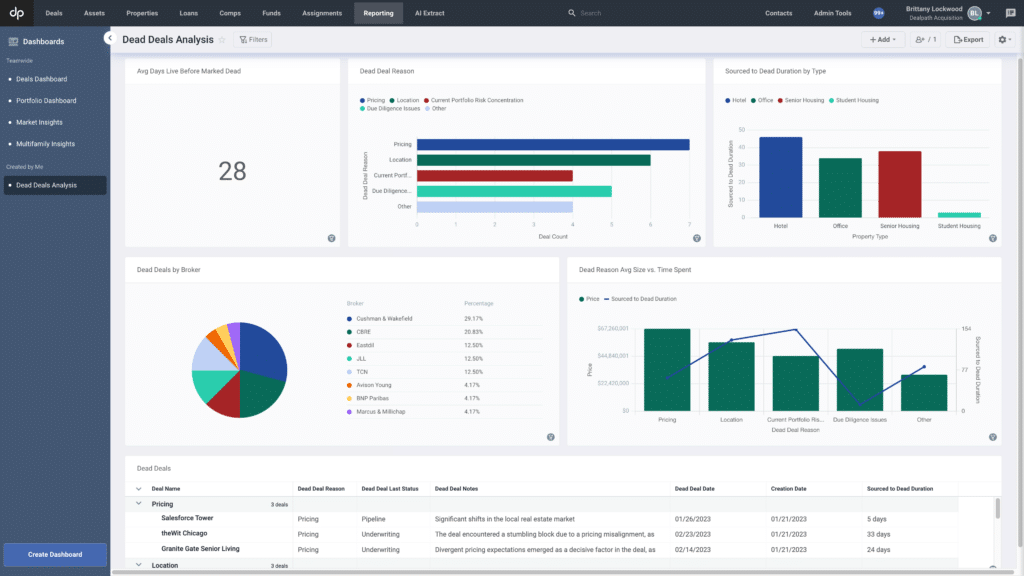
What you’ll see: A detailed analysis of deals that didn’t close, including the reasons they died, where deals died most, and other shared characteristics
Used by: A leading global real estate investment management firm with a 40+ year history
How it helps: Refine your investment strategy, limit time spent on low-performing markets, and strengthen fruitful relationships based on past performance
You can’t manage what you can’t measure. But when you’re centralizing data in Dealpath, you can measure almost anything–including why deals didn’t close.
The dead deal analysis dashboard for real estate turns past deals into learning opportunities by illuminating trends. For example, tracking something as simple as how long deals stay live before being marked as dead can reveal inefficiencies and bottlenecks, positioning you to strengthen efficiency. If certain deal types typically don’t make it past underwriting, then it might be time to update your investment criteria.
Conversely, you can also examine which deals are the most performant to understand where to double down. If a particular broker is frequently submitting deals that close, then it might make sense to strengthen that relationship.
This dashboard also reveals patterns, such as which deals take longer to fall through, helping you refine your process. By analyzing deal flow through this lens, your team can maximize its focus on performant deals.
4. Real Estate Development Dashboard
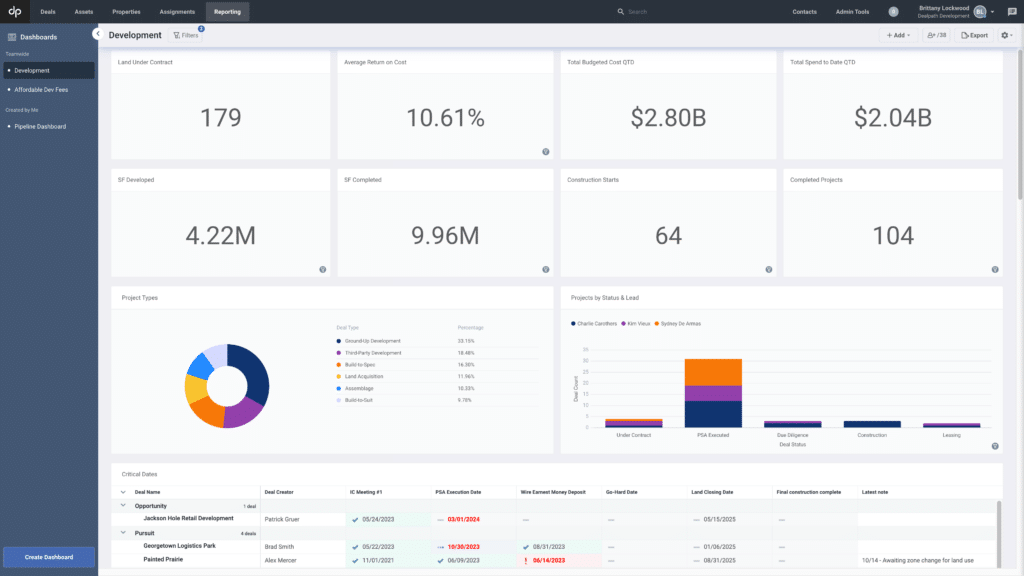
What you’ll see: A comprehensive view of development progress across your pipeline, from projects in site selection through delivery, including cost, critical dates and other metrics
Used by: A privately owned real estate development company specializing in industrial and office projects across North America and Europe
How it helps: Track progress against milestones and target delivery dates, benchmark against historical trends, analyze development projects in aggregate, and optimize budgeting and resource allocation
Overseeing multiple projects across the various stages of your development pipeline can make it challenging to track shifting critical and target completion dates. Building a real estate development dashboard in Dealpath helps teams track projects through the entire lifecycle, including pre-development, construction and operation, creating significant cost and time efficiencies.
Tracking projects in one source of truth eliminates frustrating and time-consuming manual work, like tracking down fragmented data. Instead, project managers can confidently report progress to stakeholders like executives.
Beyond target dates, a real estate development dashboard can also offer a more holistic view into development activity through various lenses, such as square footage or acres developed to date, acres under contract for land that has not yet been developed, acres developed by year, and project completions by month.
Real estate development dashboards can even aid in budgeting, offering a live view of year-to-date spending, compared against budgeting. These financial insights and projections can help your firm strategize when it comes to budgeting, as well as make mid-year optimizations.
5. Multifamily Real Estate Dashboard
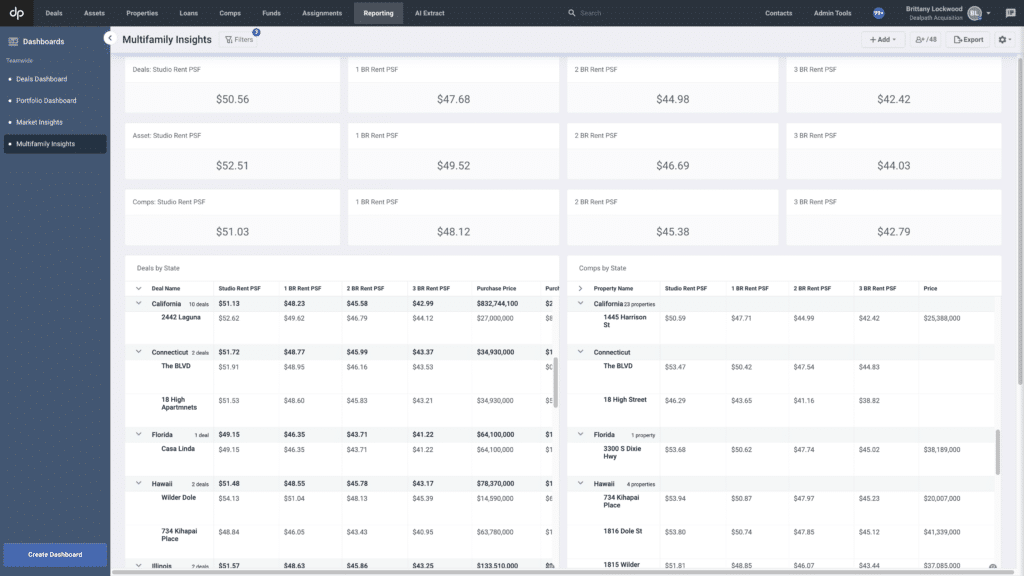
What you’ll see: A holistic comparison of rent per square foot across deals, owned assets, and comps, broken out by region and unit type
Used by: A family-owned developer, investor and owner of affordable housing nationwide
How it helps: Identify high-performing markets and surface rent trends to make better-informed investment decisions
In the dynamic and growing multifamily market, it’s no secret that hyperlocal insights will crown the winners. A multifamily-focused real estate dashboard in Dealpath can help teams deepen their competitive advantage by understanding how their current deals stack up against both their existing portfolio and third-party comps. By comparing rent per square foot across unit types, teams can quickly evaluate deals based on portfolio performance.
Granular visibility into data and trends for each target market ensures teams can refine their strategies based on evolving market conditions. Uniting rent and unit-level data, this property and asset dashboard positions teams to capitalize on emerging trends and mitigate risk.
6. Portfolio Dashboard
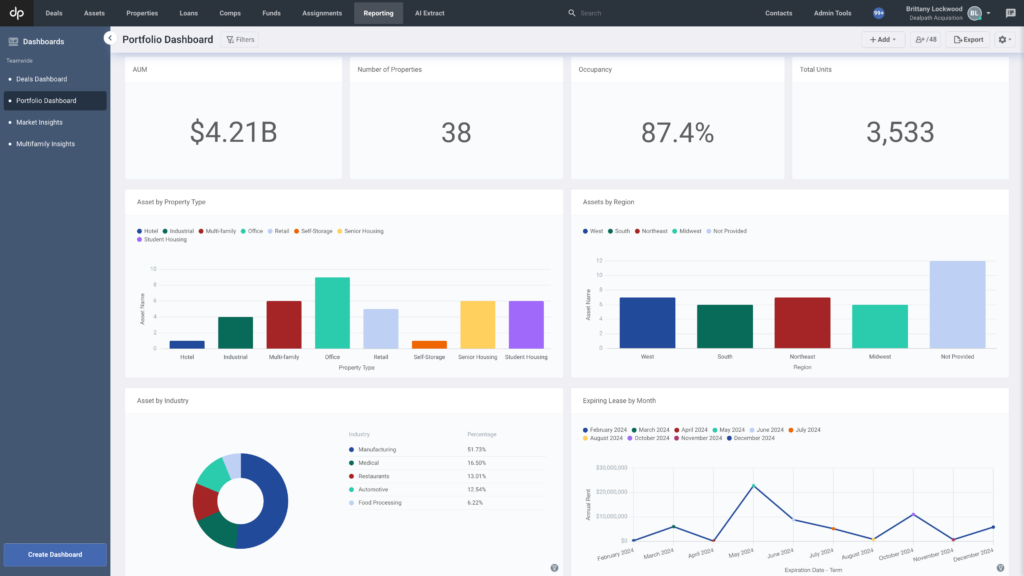
What you’ll see: A high-level overview of portfolio health, including global metrics such as asset count, AUM, occupancy rates and exposure to specific sectors or regions
Used by: A leading global real estate investment management firm with a 40+ year history
How it helps: Create firmwide visibility into portfolio health and distribution across funds to support risk management decisions, enhance investor reporting and inform future allocation decisions
The faster you can surface insights about portfolio performance, the sooner you can safeguard your investments. Relying on a real estate portfolio dashboard in Dealpath helps firms to keep a real-time pulse on key performance indicators like AUM, total asset count, and occupancy rates to mitigate risk, rebalance portfolio composition, and maintain a competitive advantage while maximizing returns.
When new headlines about potentially troubled banks arise, you won’t want to wait for a professional to create a report to act. Instead, simply view a portfolio dashboard to understand what your exposure to a particular lender–or sponsor–looks like.
Slicing portfolio performance by region, investment type and manager can also shed light on performance trends, yielding insights that inform your investment strategy. For example, if industrial deals in Miami are performing above targets, why not double down?
Portfolio real estate dashboards can drive investor relations, too. Analyzing fund distribution across your portfolio can help inform investor reporting, while potentially sharpening your fund allocation process.
7. Disposition/Sales Dashboard
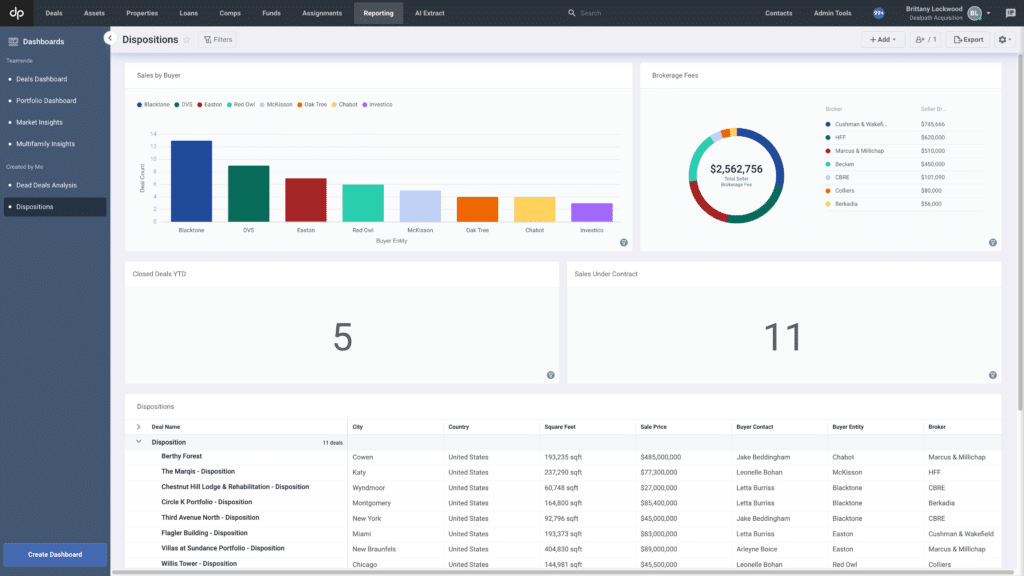
What you’ll see: A roll-up of disposition activity such as the number of deals closed and under contract, as well as broker and buyer insights
Used by: A privately owned real estate development company specializing in industrial and build-to-suit projects
How it helps: Gain visibility into disposition volume and velocity to inform future dispositions and double down on performant buyer/broker relationships
The disposition dashboard helps investment and portfolio management teams gain clearer visibility into sale activity. Tracking disposition data in one place helps teams analyze sales activity to see which markets and relationships are driving the highest returns.
First, this real estate dashboard offers a clear view into the total number of dispositions closed and under contract. This insight helps firms to evaluate how their strategies align with historical benchmarks and current goals.
Secondly, this dashboard also offers visibility into asset sales sliced by broker and buyer. By seeing which brokers and buyers are involved with successful transactions, firms can choose which relationships to strengthen.
Analyzing sales trends over time and tracking brokerage fees enables firms to refine their strategies, optimize their sales process, and ensure they’re building valuable long-term relationships.
8. Homebuilders Dashboard
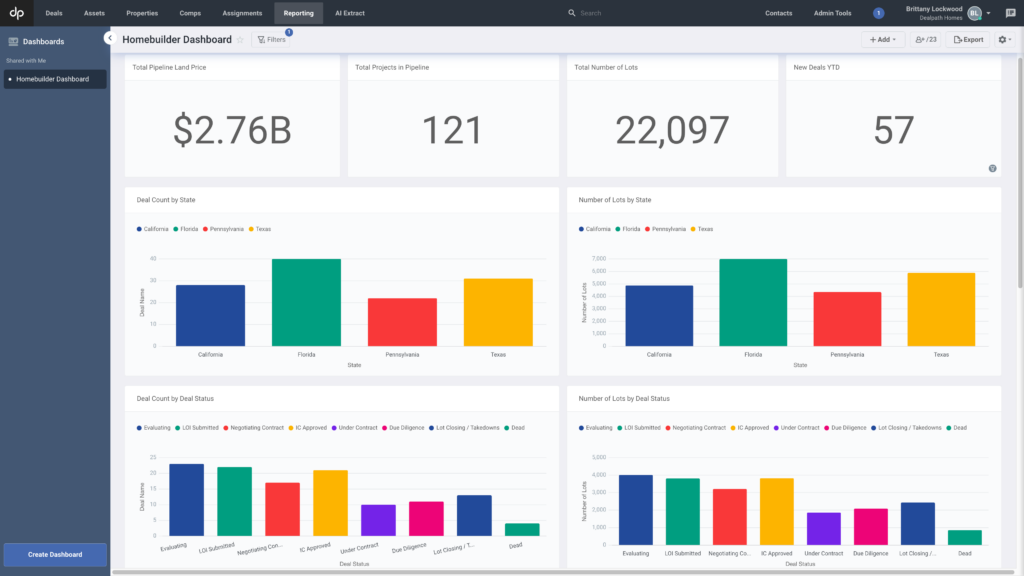
What you’ll see: An overview of land and lot pipeline projects across operating divisions by region and status, including both deal and lot counts
Used by: A national homebuilder focused on markets from the Mountain West to the South
How it helps: Monitor project momentum across regions and manage deal and lot count risk
Uniting data across all your homebuilding projects–from those in early stages like prospecting to the sale of your first home–creates real-time insight into both deal flow and lot count distribution. Consequently, firms can ensure they accomplish each milestone, while staying abreast of market trends and regional distribution to build stronger momentum and boost speed-to-market.
By tracking metrics like total pipeline land price and the number of lots under development, firms can assess the health of their lot pipelines, while avoiding overexposure. This data empowers teams to make informed decisions about where to allocate resources and focus their efforts.
What Other Dashboards Can I Create?
When it comes to surfacing other insights via real estate, the sky’s the limit. If you can measure it, we can visualize it.
We’ve included the most popular dashboards that customers rely on in Dealpath in this blog post, but in reality, you can get creative and aggregate any data you’re tracking to fuel your investment strategy. From a potential sourcing breakdown, to a global dashboard, to market insights and comparables in a specific region, Dealpath customers often work with our market-leading customer success team to uncover new insights based on their investment strategies.
Teams looking to integrate Dealpath to PowerBI, Tableau, or another business intelligence platform can do so via the open API. Automating data streams puts insights at your fingertips, streamlining actions like asset handoffs while boosting accuracy. Connecting the top and bottom of the funnel empowers your firm to surface even deeper insights to make more holistic decisions, act on real-time market trends, and marry investment strategies with high-performing portfolio strategies.
Request a Demo to Unlock Real Estate Dashboards
Ready to learn how you can surface new insights with real estate dashboards? Request a demo to learn how your firm can elevate its competitive advantage.
Request Demo
